
Sales reps can track their results and managers can see their team’s performance.
You can see deals and activities across time or any data point you want. Create charts to view the team members that bring more revenue, understand the reasons behind your data and make corrections to your sales process.
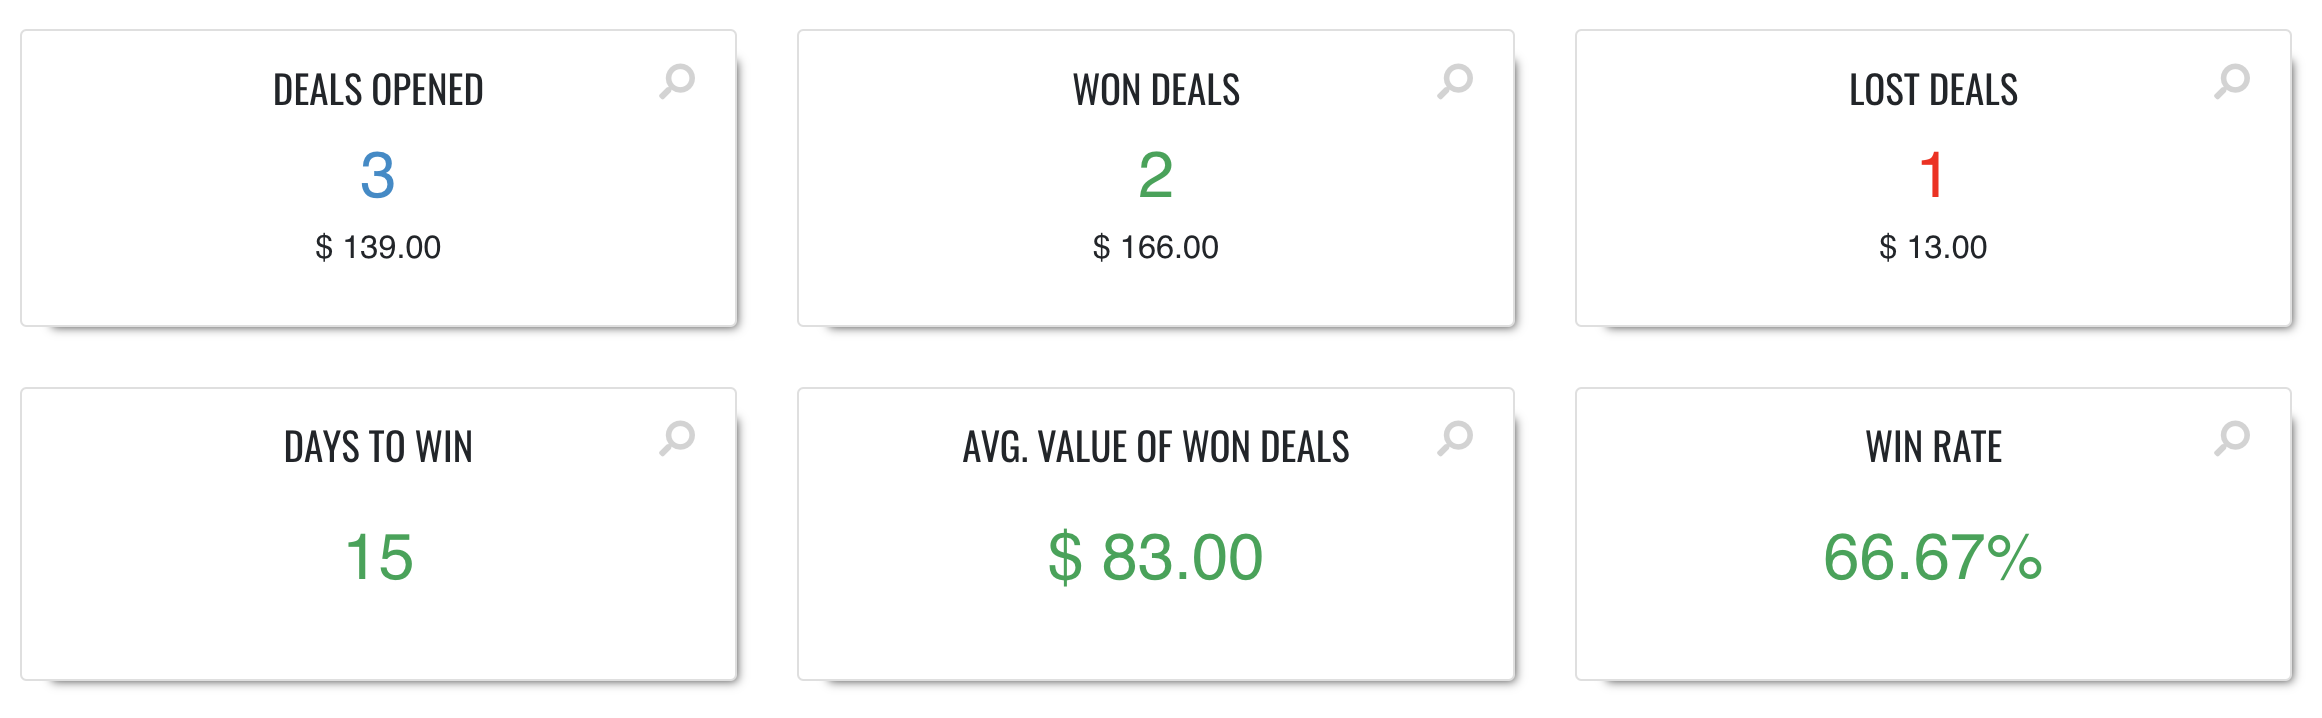
You can identify trends, uncover areas for enhancement, and align your sales efforts. You can obtain these important sales KPIs per user and pipeline:
- Sales Revenue
- Sales Growth
- Sales Pipeline Value
- Sales Velocity (days to win)
- Average Deal Size
- Win Rate
- Pipeline Stage Aging
- Pipeline Stage Velocity
The reports have several filters on the top. Be careful to select them correctly to view the information.
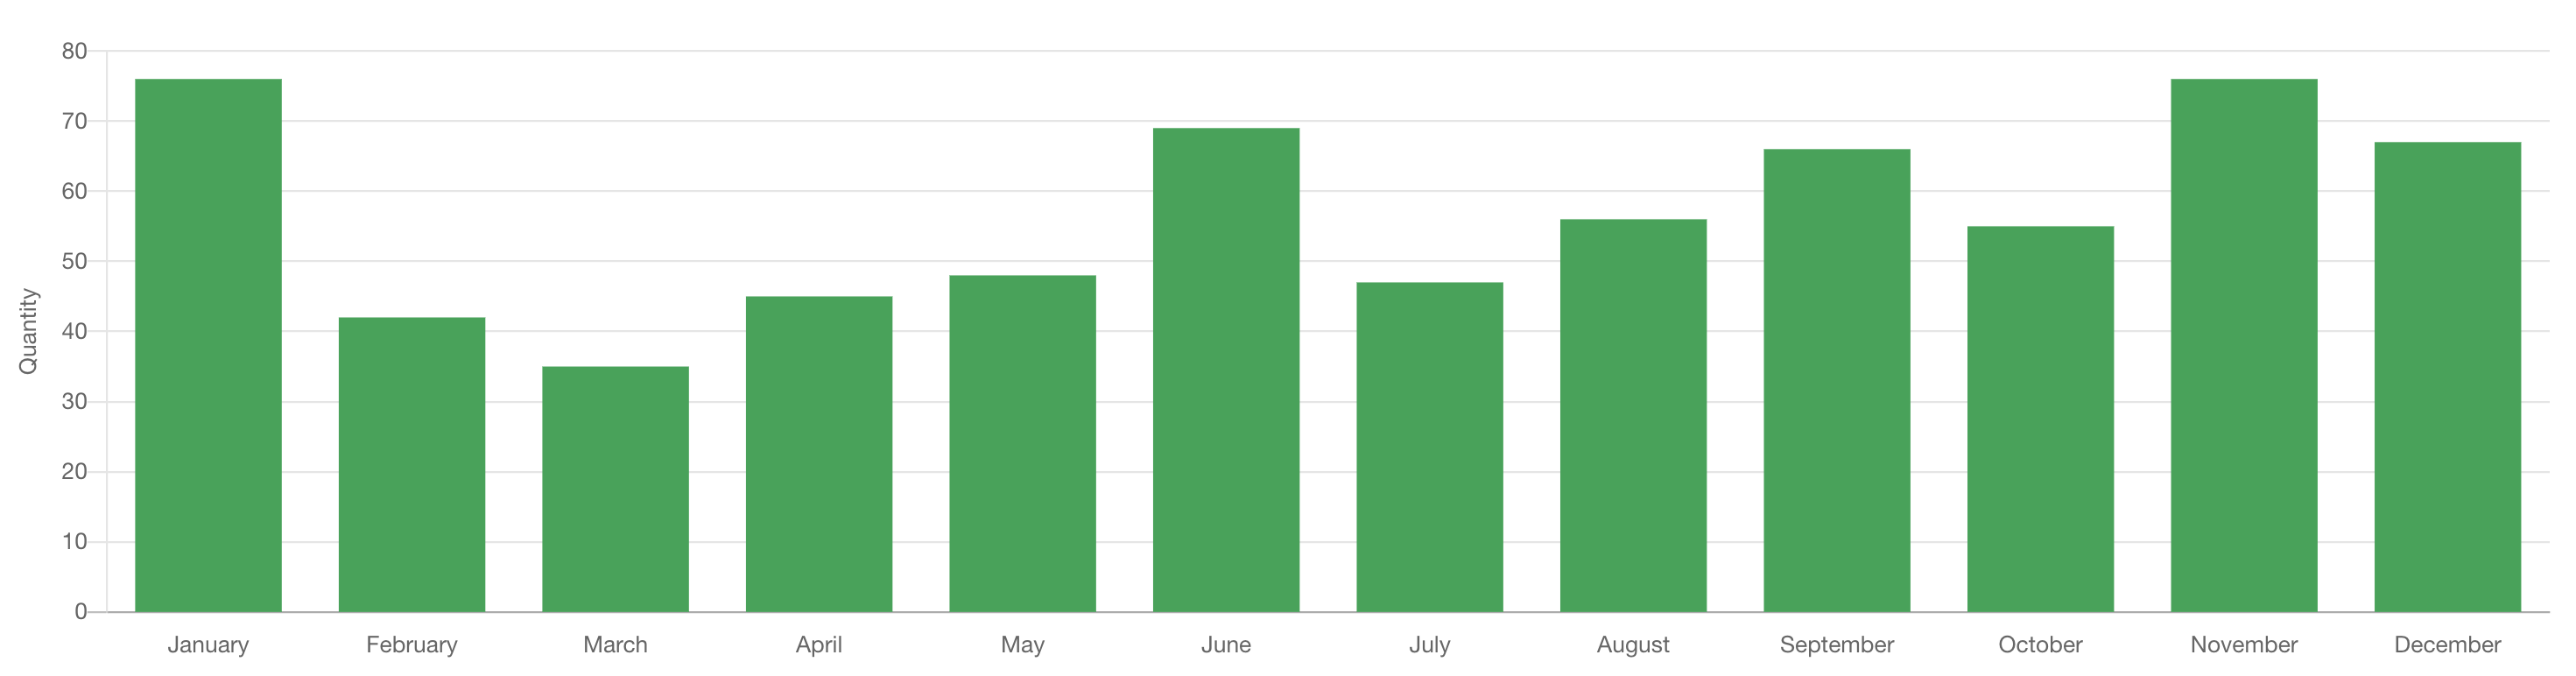

Sales Report
This reports provides a chart with data about the closed deals by period
Sales Forecast
Similar to the Sales Report but provides the expected sales volume based on the expected closing date.
Days to win
The average deal duration.
Win rate
This is your sales conversion rate.
Pipeline Stage Aging
Shows the age of deals still in each pipeline stage during the selected period, helping you identify bottlenecks.
Note: Median days are shown because the average can be inflated by long-stalled or forgotten deals that remain open in a stage for an extended period. The median provides a more reliable view of the typical time spent in the stage.
Pipeline Stage Velocity
Shows the average time deals take to move through (complete) each stage, helping you improve stage efficiency.
Sales Goals
View your sales goals or the goals of your team. Advanced Plan required.
Sales by Product – Quotes
View your sales (won deals) based on the products you sold. This works on the product added to “quotes”. Standard Plan required.
Forecast by Product – Quotes
View the products in your Pipelines. This report let you see the products added to your “quotes” and it is based on expected closing date. Very useful for provisioning. Standard Plan required.
Active Subscriptions
Recurring revenue and number of subscriptions active in a time frame. Standard Plan required.
New Subscriptions
Subscriptions that have been activated during a time frame. Standard Plan required.
Ended Subscriptions
Subscription that have been ended/cancelled during a time frame. Standard Plan required.
Lost Deals
View the deals you lost.
Deals Opened
View the deals by open date.
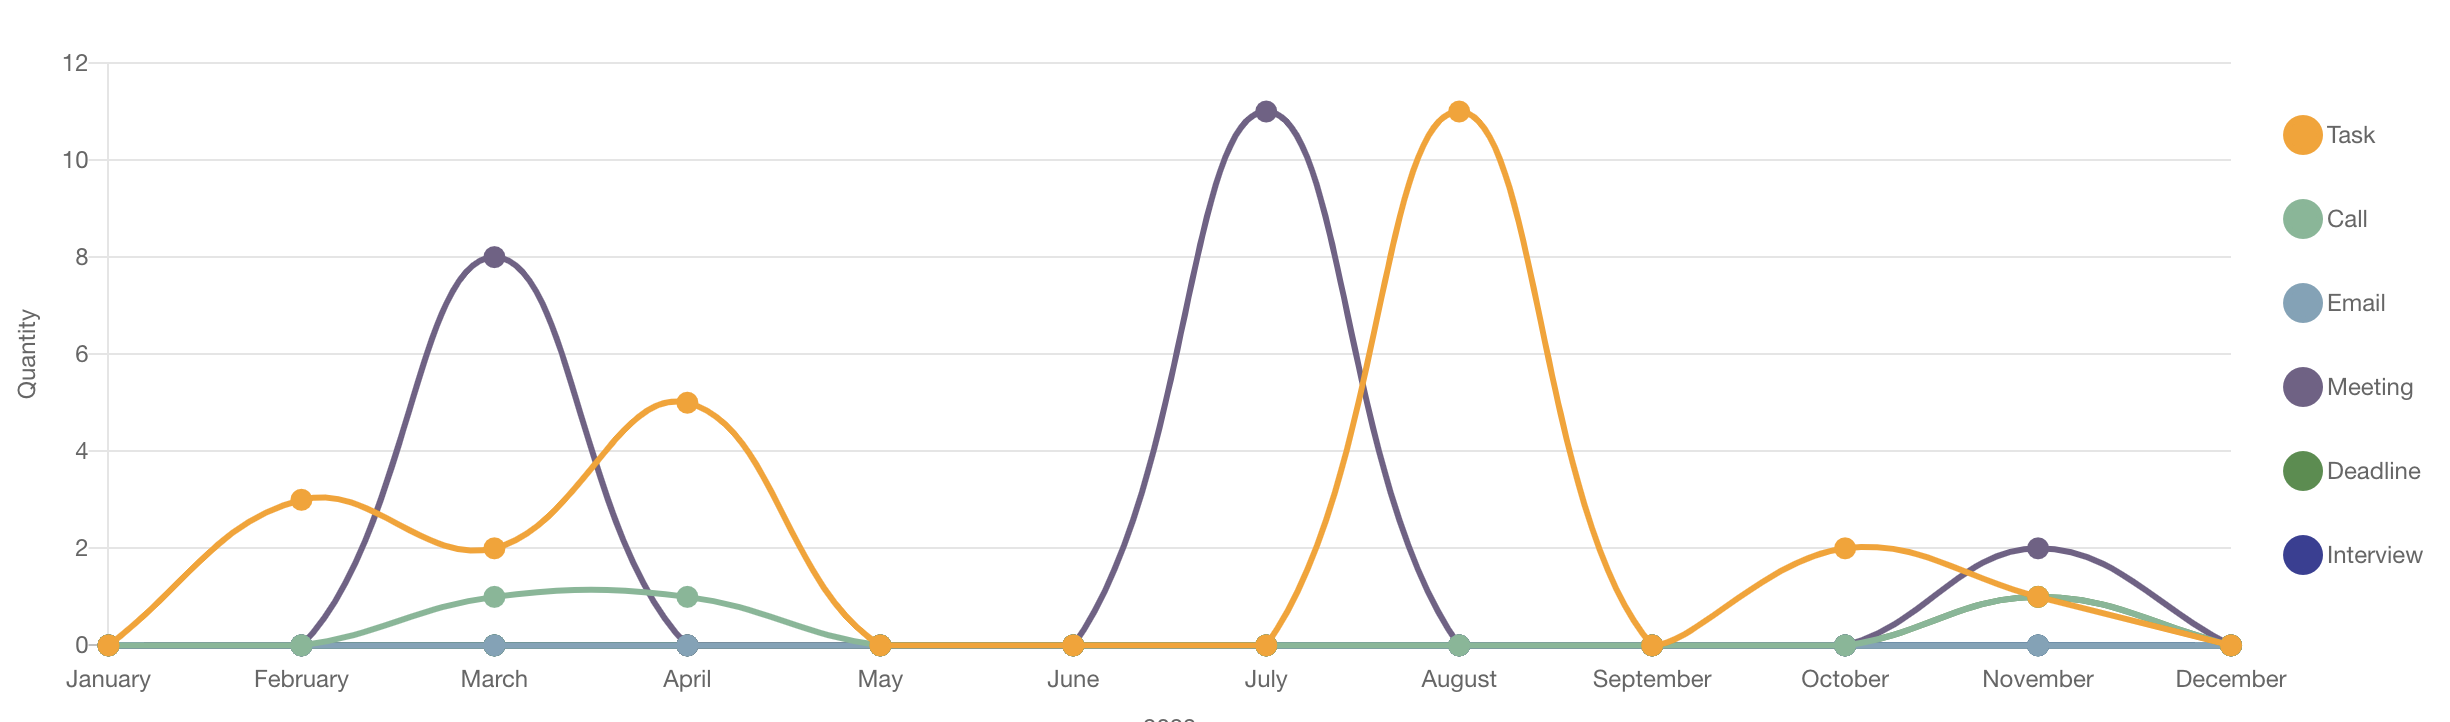
Events
View the events added to calendar by type (Task, Call, Meeting, etc.)
Events Completed
Like Events, but shows the events marked as done.
We provide reports that offer an insightful overview of most businesses’ operations. We are not currently offering custom reporting but we allow you to easily download data through our user interface or APIs. With tools like Excel pivots, you can build any additional views. For those seeking tailored reporting solutions, our Enterprise Plan offers the option.